Ficheiro:Mollifier illustration.png
Sem resolução maior disponível.
Mollifier_illustration.png (500 × 158 píxeis, tamanho: 6 kB, tipo MIME: image/png)
|
|
Esta imagem provém do Wikimedia Commons, um acervo de conteúdo livre da Wikimedia Foundation que pode ser utilizado por outros projetos.
|
Descrição do ficheiro

|
File:Mollifier Illustration.svg é uma versão vetorial deste ficheiro. Ela deve ser usada em vez desta imagem em formato raster, se não for de qualidade inferior.
File:Mollifier illustration.png → File:Mollifier Illustration.svg
Para mais informações, consulte Ajuda:SVG. |
| Descrição |
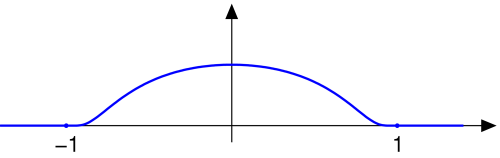
Français : fonction mollifiante, C_infini à support compact |
| Origem | Obra do próprio |
| Autor | Oleg Alexandrov 08:56, 19 July 2007 (UTC) |
Licenciamento
| Eu, titular dos direitos de autor desta obra, dedico-a ao domínio público, com aplicação em todo o mundo. Nalguns países isto pode não ser legalmente possível; se assim for: Concedo a todos o direito de usar esta obra para qualquer fim, sem quaisquer condições, a menos que tais condições sejam impostas por lei. |
Source code (Matlab)
function main()
   thickness1=2; thickness2=1; arrowsize=5; arrow_type=2; ball_rad=0.012;
   blue=[0, 0, 1]; fontsize=25; dist=0.005;

   a=-1.4; b=-a;
   h=0.01;
   X=a:h:b;
   Y=zeros(length(X), 1);
   for i=1:length(X)
      x=X(i);
      if x < 1 & x > -1
	 Y(i)=exp(-1/(1-x^2));
      end
   end


figure(1);  clf; hold on; axis equal; axis off
arrow([a 0], [b+0.2, 0], thickness2, arrowsize, pi/8,arrow_type, [0, 0, 0])
arrow([0 -0.1], [0 2.*max(Y)], thickness2, arrowsize, pi/8,arrow_type, [0, 0, 0])
plot(X, Y, 'linewidth', thickness1, 'color', [0 0 1]);
arrow([b+0.1 0], [b+0.2, 0], thickness2, arrowsize, pi/8,arrow_type, [0, 0, 0])

ball(1, 0, ball_rad, blue); ball(-1, 0, ball_rad, blue);
place_text_smartly(1, fontsize, 6, dist, '1');
place_text_smartly(-1, fontsize, 6, dist, '-1');

saveas(gcf, 'mollifier_illustration.eps', 'psc2')

function place_text_smartly (z, fs, pos, d, tx)
 p=cos(pi/4)+sqrt(-1)*sin(pi/4);
 z = z + p^pos * d * fs;
 shiftx=0.0003;
 shifty=0.002;
 x = real (z); y=imag(z);
 H=text(x+shiftx*fs, y+shifty*fs, tx); set(H, 'fontsize', fs, 'HorizontalAlignment', 'c', 'VerticalAlignment', 'c')

function ball(x, y, r, color)
   Theta=0:0.1:2*pi;
   X=r*cos(Theta)+x;
   Y=r*sin(Theta)+y;
   H=fill(X, Y, color);
   set(H, 'EdgeColor', color);

function arrow(start, stop, thickness, arrowsize, sharpness, arrow_type, color)

%  draw a line with an arrow at the end
%  start is the x,y point where the line starts
%  stop is the x,y point where the line stops
%  thickness is an optional parameter giving the thickness of the lines
%  arrowsize is an optional argument that will give the size of the arrow
%  It is assumed that the axis limits are already set
%  0 < sharpness < pi/4 determines how sharp to make the arrow
%  arrow_type draws the arrow in different styles. Values are 0, 1, 2, 3.

%       8/4/93    Jeffery Faneuff
%       Copyright (c) 1988-93 by the MathWorks, Inc.
%       Modified by Oleg Alexandrov 2/16/03


   if nargin <=6
      color=[0, 0, 0];
   end

   if (nargin <=5)
      arrow_type=0;   % the default arrow, it looks like this: ->
   end

   if (nargin <=4)
      sharpness=pi/4; % the arrow sharpness - default = pi/4
   end

   if nargin<=3
      xl = get(gca,'xlim');
      yl = get(gca,'ylim');
      xd = xl(2)-xl(1);
      yd = yl(2)-yl(1);
      arrowsize = (xd + yd) / 2;   % this sets the default arrow size
   end

   if (nargin<=2)
      thickness=0.5; % default thickness
   end


   xdif = stop(1) - start(1);
   ydif = stop(2) - start(2);

   if (xdif == 0)
      if (ydif >0)
	 theta=pi/2;
      else
	 theta=-pi/2;
      end
   else
      theta = atan(ydif/xdif);  % the angle has to point according to the slope
   end

   if(xdif>=0)
      arrowsize = -arrowsize;
   end

   if (arrow_type == 0) % draw the arrow like two sticks originating from its vertex
      xx = [start(1), stop(1),(stop(1)+0.02*arrowsize*cos(theta+sharpness)),NaN,stop(1),...
	    (stop(1)+0.02*arrowsize*cos(theta-sharpness))];
      yy = [start(2), stop(2), (stop(2)+0.02*arrowsize*sin(theta+sharpness)),NaN,stop(2),...
	    (stop(2)+0.02*arrowsize*sin(theta-sharpness))];
      plot(xx,yy, 'LineWidth', thickness, 'color', color)
   end

   if (arrow_type == 1)  % draw the arrow like an empty triangle
      xx = [stop(1),(stop(1)+0.02*arrowsize*cos(theta+sharpness)), ...
	    stop(1)+0.02*arrowsize*cos(theta-sharpness)];
      xx=[xx xx(1) xx(2)];

      yy = [stop(2),(stop(2)+0.02*arrowsize*sin(theta+sharpness)), ...
	    stop(2)+0.02*arrowsize*sin(theta-sharpness)];
      yy=[yy yy(1) yy(2)];

      plot(xx,yy, 'LineWidth', thickness, 'color', color)

%     plot the arrow stick
      plot([start(1) stop(1)+0.02*arrowsize*cos(theta)*cos(sharpness)], [start(2), stop(2)+ ...
		    0.02*arrowsize*sin(theta)*cos(sharpness)], 'LineWidth', thickness, 'color', color)

   end

   if (arrow_type==2) % draw the arrow like a full triangle
      xx = [stop(1),(stop(1)+0.02*arrowsize*cos(theta+sharpness)), ...
	    stop(1)+0.02*arrowsize*cos(theta-sharpness),stop(1)];

      yy = [stop(2),(stop(2)+0.02*arrowsize*sin(theta+sharpness)), ...
	    stop(2)+0.02*arrowsize*sin(theta-sharpness),stop(2)];

%     plot the arrow stick
      plot([start(1) stop(1)+0.01*arrowsize*cos(theta)], [start(2), stop(2)+ ...
		    0.01*arrowsize*sin(theta)], 'LineWidth', thickness, 'color', color)
      H=fill(xx, yy, color);% fill with black
      set(H, 'EdgeColor', 'none')

   end

   if (arrow_type==3) % draw the arrow like a filled 'curvilinear' triangle
      curvature=0.5; % change here to make the curved part more curved (or less curved)
      radius=0.02*arrowsize*max(curvature, tan(sharpness));
      x1=stop(1)+0.02*arrowsize*cos(theta+sharpness);
      y1=stop(2)+0.02*arrowsize*sin(theta+sharpness);
      x2=stop(1)+0.02*arrowsize*cos(theta)*cos(sharpness);
      y2=stop(2)+0.02*arrowsize*sin(theta)*cos(sharpness);
      d1=sqrt((x1-x2)^2+(y1-y2)^2);
      d2=sqrt(radius^2-d1^2);
      d3=sqrt((stop(1)-x2)^2+(stop(2)-y2)^2);
      center(1)=stop(1)+(d2+d3)*cos(theta);
      center(2)=stop(2)+(d2+d3)*sin(theta);

      alpha=atan(d1/d2);
      Alpha=-alpha:0.05:alpha;
      xx=center(1)-radius*cos(Alpha+theta);
      yy=center(2)-radius*sin(Alpha+theta);
      xx=[xx stop(1) xx(1)];
      yy=[yy stop(2) yy(1)];

%     plot the arrow stick
      plot([start(1) center(1)-radius*cos(theta)], [start(2), center(2)- ...
		    radius*sin(theta)], 'LineWidth', thickness, 'color', color);

      H=fill(xx, yy, color);% fill with black
      set(H, 'EdgeColor', 'none')

   end
| date/time | username | edit summary |
|---|---|---|
| 04:29, 23 November 2005 | en:User:Oleg Alexandrov | (rm space) |
| 04:27, 23 November 2005 | en:User:Mathbot | (source code) |
| 04:21, 23 November 2005 | en:User:Oleg Alexandrov |
Registo de carregamento original
Legend: (cur) = this is the current file, (del) = delete this old version, (rev) = revert to this old version.
Click on date to download the file or see the image uploaded on that date.
- (del) (cur) 04:47, 23 November 2005 . . en:User:Oleg_Alexandrov Oleg Alexandrov ( en:User_talk:Oleg_Alexandrov Talk) . . 500x158 (5669 bytes)
Histórico do ficheiro
Clique uma data e hora para ver o ficheiro tal como ele se encontrava nessa altura.
| Data e hora | Miniatura | Dimensões | Utilizador | Comentário | |
|---|---|---|---|---|---|
| atual | 19h39min de 19 de março de 2006 | 500 × 158 (6 kB) | Maksim | La bildo estas kopiita de wikipedia:en. La originala priskribo estas: == Licensing == {{PD-self}} ==Source code (Matlab)== <pre><nowiki> function main() thickness1=2; thickness2=1; arrowsize=5; arrow_type=2; ball_rad=0.012; blue=[0, 0, 1]; fo |
Utilização local do ficheiro
A seguinte página usa este ficheiro:
Utilização global do ficheiro
As seguintes wikis usam este ficheiro:
- ca.wikipedia.org
- de.wikipedia.org
- en.wikipedia.org
- en.wikibooks.org
- it.wikipedia.org
- ko.wikipedia.org
- nl.wikipedia.org
- sv.wikipedia.org