Ficheiro:XYZ-DIS magnetic field coordinates.svg

Dimensões desta antevisão em PNG do ficheiro SVG: 512 × 175 píxeis Outras resoluções: 320 × 109 píxeis | 640 × 219 píxeis | 1 024 × 350 píxeis | 1 280 × 438 píxeis | 2 560 × 875 píxeis.
Imagem numa resolução maior (ficheiro SVG, de 512 × 175 píxeis, tamanho: 8 kB)
|
|
Esta imagem provém do Wikimedia Commons, um acervo de conteúdo livre da Wikimedia Foundation que pode ser utilizado por outros projetos.
|
Descrição do ficheiro
| Descrição |
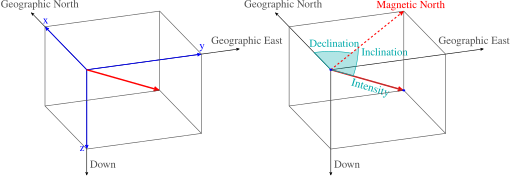
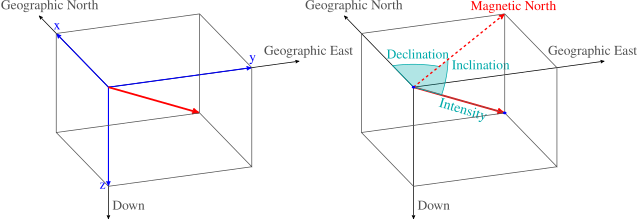
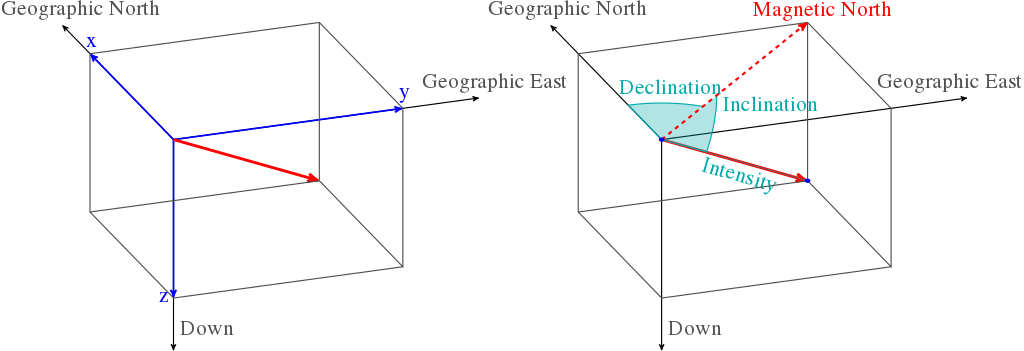
English: The graphic serves to represent the analogy of the XYZ and the more commonly used DIS coordinate systems. Blue indicated the coordinates in the two different systems, while red indicates the resultant magnetic field. |
| Data | |
| Origem |
Obra do próprio |
| Autor |
Chymæra Recreated in LaTeX by: Rubber Duck (☮ • ✍) |
| SVG desenvolvimento | O código-fonte desta imagem SVG é válido. Este(a) desenho vetorial foi criado com o Other tools por Rubber Duck (☮ • ✍) and converted to SVG using dvisvgm and manually edited. |
| Código fonte | SVG code\documentclass[12pt,border=0pt,tikz,class=scrartcl,multi=false]{standalone}
\usepackage{times}
\usepackage{pgfplots}
\pgfplotsset{compat=1.10}
\usetikzlibrary{arrows,decorations.text}
\usepackage{tikz-3dplot}
\pagestyle{empty}
\begin{document}
\def\LA{2}
\def\Lb{1.5}
\def\gap{1.5cm}
\tdplotsetmaincoords {-60}{70}
\begin{tikzpicture}[thick,auto,>=stealth',xscale=4,yscale=3,tdplot_main_coords]
\begin{scope} [xshift=-\gap]
\draw [->] (0,0,0) -- (-\LA,0,0) node [anchor=south,gray] {Geographic North};
\draw [->] (0,0,0) -- (0,\LA,0) node [anchor=south,gray] {Geographic East};
\draw [->] (0,0,0) -- (0,0,\LA) node [pos=.9,right,gray] {Down};
\draw [->,blue,very thick] (0,0,0) -- (-\Lb,0,0) node [anchor=south] {x};
\draw [->,blue,very thick] (0,0,0) -- (0,\Lb,0) node [anchor=south] {y};
\draw [->,blue,very thick] (0,0,0) -- (0,0,\Lb) node [left] {z};
\draw [->,red,line width=2pt] (0,0,0) -- (-\Lb,\Lb,\Lb);
\draw [gray] (-\Lb,0,0) -- ++(0,\Lb,0) -- ++(\Lb,0,0)
-- ++(0,0,\Lb) -- ++(-\Lb,0,0) -- ++(0,0,-\Lb)
(-\Lb,0,0) -- ++(0,0,\Lb) -- ++(\Lb,0,0) -- ++(0,\Lb,0)
(-\Lb,0,\Lb) -- ++(0,\Lb,0)
;
\end{scope}
\begin{scope} [xshift=\gap]
\draw [->] (0,0,0) -- (-\LA,0,0) node [anchor=south,gray] {Geographic North};
\draw [->] (0,0,0) -- (0,\LA,0) node [anchor=south,gray] {Geographic East};
\draw [->] (0,0,0) -- (0,0,\LA) node [pos=.9,right,gray] {Down};
\draw [->,red,line width=2pt] (0,0,0) -- (-\Lb,\Lb,\Lb);
\draw [thin,cyan,postaction={decoration={text along path,
raise=-10pt,text color=cyan,text align={center},
text={Intensity} },decorate}]
(0,0,0) -- (-\Lb,\Lb,\Lb);
\tdplotsetthetaplanecoords{135};
%\tdplotdrawarc [tdplot_rotated_coords,cyan] {(0,0,0)} {.8} {55}{90}{above right=5pt and 0pt}{Inclination};
\draw [tdplot_rotated_coords,fill=cyan,fill opacity=.3,cyan] (0,.8,0)
arc (90:55:.8) node [pos=.1,right,opacity=1] {Inclination}
-- (0,0,0);
%\tdplotdrawarc [cyan,fill=cyan] {(0,0,0)} {.6} {180}{135}{above}{Declination};
\draw [cyan,fill=cyan,fill opacity=.3] (0,0,0) -- (-.6,0,0)
arc (180:135:.6) node [above,pos=.5,opacity=1] {Declination};
\draw [gray] (-\Lb,0,0) -- ++(0,\Lb,0) -- ++(\Lb,0,0)
-- ++(0,0,\Lb) -- ++(-\Lb,0,0) -- ++(0,0,-\Lb)
(-\Lb,0,0) -- ++(0,0,\Lb) -- ++(\Lb,0,0) -- ++(0,\Lb,0)
(-\Lb,0,\Lb) -- ++(0,\Lb,0)
;
\draw [->,red,dashed, line width=1.5pt] (0,0,0) -- (-\Lb,\Lb,0) node [anchor=south] {Magnetic North};
\draw [fill=blue,draw=none] (0,0,0) circle (.5pt) (-\Lb,\Lb,\Lb) circle (.5pt);
\end{scope}
\end{tikzpicture}
\end{document}
|

|
Este ficheiro SVG contém texto integrado que pode ser traduzido para a sua língua, usando um editor que possa suportar SVG (como XML ou texto). Para mais informações, consulte: Sobre a tradução de ficheiros SVG. |
Licenciamento
Eu, titular dos direitos de autor desta obra, publico-a com a seguinte licença:
A utilização deste ficheiro é regulada nos termos da licença Creative Commons - Atribuição-CompartilhaIgual 3.0 Não Adaptada.
- Pode:
- partilhar – copiar, distribuir e transmitir a obra
- recombinar – criar obras derivadas
- De acordo com as seguintes condições:
- atribuição – Tem de fazer a devida atribuição da autoria, fornecer uma hiperligação para a licença e indicar se foram feitas alterações. Pode fazê-lo de qualquer forma razoável, mas não de forma a sugerir que o licenciador o apoia ou subscreve o seu uso da obra.
- partilha nos termos da mesma licença – Se remisturar, transformar ou ampliar o conteúdo, tem de distribuir as suas contribuições com a mesma licença ou uma licença compatível com a original.
Histórico do ficheiro
Clique uma data e hora para ver o ficheiro tal como ele se encontrava nessa altura.
| Data e hora | Miniatura | Dimensões | Utilizador | Comentário | |
|---|---|---|---|---|---|
| atual | 19h26min de 22 de abril de 2015 | 512 × 175 (8 kB) | Krishnavedala | increased font size and more optimized | |
| 19h17min de 22 de abril de 2015 | 892 × 306 (8 kB) | Krishnavedala | Better drawing with bigger and legible translatable fonts. | ||
| 02h17min de 8 de junho de 2012 |  | 644 × 266 (27 kB) | Chymæra | font issues | |
| 01h58min de 8 de junho de 2012 |  | 644 × 266 (29 kB) | Chymæra | {{subst:Upload marker added by en.wp UW}} {{Information |Description = {{en|The graphic serves to represent the analogy of the XYZ and the more commonly used DIS coordinate systems. Blue indicated the coordinates in the two different systems, while red... |
Utilização local do ficheiro
As seguintes 2 páginas usam este ficheiro:
Utilização global do ficheiro
As seguintes wikis usam este ficheiro:
- ast.wikipedia.org
- bn.wikipedia.org
- ca.wikipedia.org
- en.wikipedia.org
- es.wikipedia.org
- hi.wikipedia.org
- it.wikibooks.org
- it.wikiversity.org
- or.wikipedia.org
- tr.wikipedia.org
- vi.wikipedia.org