Ficheiro:Pie chart of lung cancers.svg

Dimensões desta antevisão em PNG do ficheiro SVG: 482 × 368 píxeis Outras resoluções: 315 × 240 píxeis | 629 × 480 píxeis | 1 006 × 768 píxeis | 1 280 × 977 píxeis | 2 560 × 1 955 píxeis.
Imagem numa resolução maior (ficheiro SVG, de 482 × 368 píxeis, tamanho: 18 kB)
|
|
Esta imagem provém do Wikimedia Commons, um acervo de conteúdo livre da Wikimedia Foundation que pode ser utilizado por outros projetos.
|
Descrição do ficheiro
| Descrição |
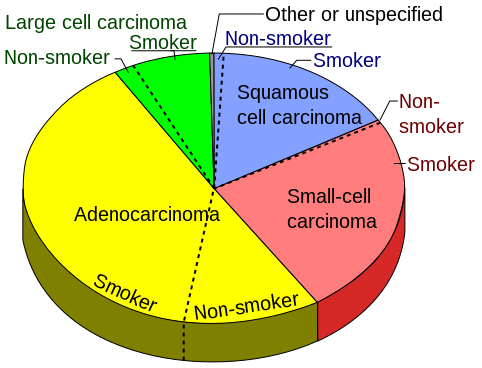
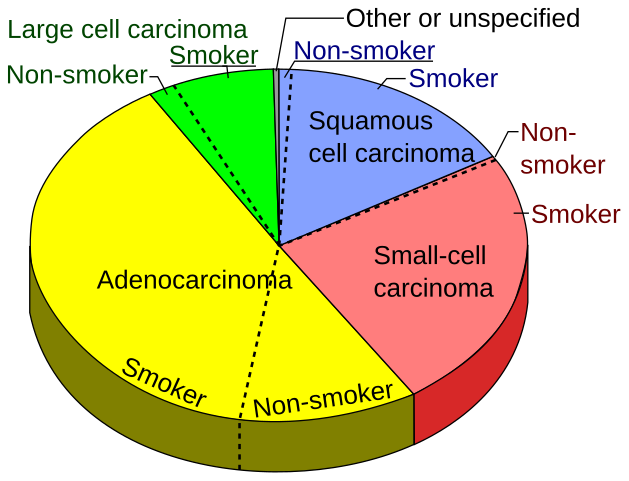
English: Pie chart of the incidence of lung cancer types, sorted by histological subtypes, in turn sorted into how many are non-smokers versus smokers - defined as current or former smoker of more than 1 year of duration according to:
Raw data: coon-smoker: 0,3% Small Cell Carcinoma - smoker: 24,0% Adenocarcinoma - non-smoker: 11,6% Adenocarcinoma - smoker: 38,9% Large Cell Carcinoma - non-smoker: 1,5% Large Cell Carcinoma - smoker: 6,7% Other or unspecified: 0,4%. |
| Data | |
| Origem | Obra do próprio |
| Autor |
When using this image in external works, it may be cited as:
or
|
Licenciamento
Eu, titular dos direitos de autor desta obra, publico-a com a seguinte licença:
| A utilização deste ficheiro é regulada nos termos Creative Commons - CC0 1.0 Dedicação Universal ao Domínio Público. | |
| A pessoa que associou uma obra a este documento dedicou-a ao domínio público, renunciando a todos os seus direitos sobre a obra em todo o mundo ao abrigo da legislação de direitos de autor, incluindo a todos os direitos legais conexos, na medida permitida por lei. Pode copiar, modificar, distribuir e executar a obra, até com fins comerciais, sem pedir autorização.
|
Histórico do ficheiro
Clique uma data e hora para ver o ficheiro tal como ele se encontrava nessa altura.
| Data e hora | Miniatura | Dimensões | Utilizador | Comentário | |
|---|---|---|---|---|---|
| atual | 16h05min de 6 de março de 2019 | | 482 × 368 (18 kB) | David.haberthuer | Reverted to version as of 16:35, 10 June 2011 (UTC) |
| 15h56min de 6 de março de 2019 |  | 1 143 × 644 (27 kB) | David.haberthuer | Redrawn with matplotlib in Python. The full drawing is done in this Jupyter notebook: https://github.com/habi/wikipedia-plots/blob/master/Cancer%20pie%20chart.ipynb | |
| 16h35min de 10 de junho de 2011 |  | 482 × 368 (18 kB) | Mikael Häggström | {{Information |Description ={{en|1=Pie chart of the incidence of lung cancer types, sorted by histological subtypes, in turn sorted into how many are non-smokers versus smokers - defined as current or former smoker of more than 1 ye |
Utilização local do ficheiro
As seguintes 4 páginas usam este ficheiro:
Utilização global do ficheiro
As seguintes wikis usam este ficheiro:
- ar.wikipedia.org
- bs.wikipedia.org
- el.wikipedia.org
- en.wikipedia.org
- en.wikiversity.org
- ha.wikipedia.org
- he.wikipedia.org
- hy.wikipedia.org
- ko.wikipedia.org
- pl.wikipedia.org
- ru.wikipedia.org
- sh.wikipedia.org
- sv.wikipedia.org