Ficheiro:Sinc function (both).svg

Dimensões desta antevisão em PNG do ficheiro SVG: 800 × 600 píxeis Outras resoluções: 320 × 240 píxeis | 640 × 480 píxeis | 1 024 × 768 píxeis | 1 280 × 960 píxeis | 2 560 × 1 920 píxeis | 1 300 × 975 píxeis.
Imagem numa resolução maior (ficheiro SVG, de 1 300 × 975 píxeis, tamanho: 42 kB)
|
|
Esta imagem provém do Wikimedia Commons, um acervo de conteúdo livre da Wikimedia Foundation que pode ser utilizado por outros projetos.
|
Descrição do ficheiro
| Descrição |
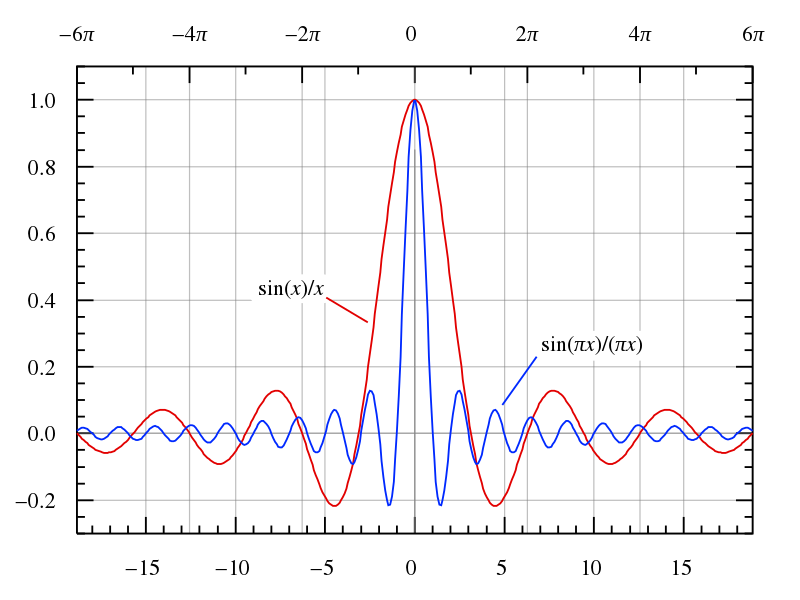
English: Graph of both the normalized (sin(πx)/(πx)) and unnormalized (sin(x)/x) definitions of the sinc function.
These are on the same scale. The second axis is just to clarify that the zero crossings occur on multiples of pi instead of integers. Instructions: |
| Data | 3 de junho de 2006 (data do carregamento) |
| Origem | Obra do próprio |
| Autor | Omegatron |
| Outras versões |
|
| SVG desenvolvimento | Este(a) desenho vetorial inválido foi criado com o Inkscape Este arquivo SVG utiliza texto incorporado que pode ser facilmente traduzido usando um editor de texto. |
| gnuplot source | click to expand
# Set 1300×975 SVG output and filename
# The font size (fsize) sets the size for the circles, too.
set samples 400
set terminal svg enhanced size 1300 975 fname "Times" fsize 36
set output "sinc function (both).svg"

# Set y axis limits so the plot doesn't go right to the edges of the graph
set yrange [-0.3:1.1]
set xrange [-6*pi:6*pi]

set lmargin 5
set bmargin -10

# No legend needed
#set nokey

# Add lightly-colored axis lines
set yzeroaxis
set xzeroaxis

# Put a y-axis tic at every 0.2
set ytics 0.2
set mytics 4

# Put an x-axis tic at every integer
set xtics 5
set format x "%2.0f"
set mxtics 5

# Put a second x-axis tic at every multiple of 2*pi

set x2tics 2*pi
set format x2 "%2.0f"
set mx2tics 2
set grid x x2 y
set xtics nomirror

# Format tics as digit with one decimal place
set format y "%2.1f"

# Plot as lines
plot sin(x)/x with lines, sin(pi*x)/(pi*x) with lines

# Close the file (so I don't have to close gnuplot to view it)
set output
|
.svg)
.svg)
.svg)
.svg)
Licenciamento
Eu, titular dos direitos de autor desta obra, publico-a com as seguintes licenças:
A utilização deste ficheiro é regulada nos termos da licença Creative Commons - Atribuição-CompartilhaIgual 3.0 Não Adaptada, 2.5 Genérica, 2.0 Genérica e 1.0 Genérica.
- Pode:
- partilhar – copiar, distribuir e transmitir a obra
- recombinar – criar obras derivadas
- De acordo com as seguintes condições:
- atribuição – Tem de fazer a devida atribuição da autoria, fornecer uma hiperligação para a licença e indicar se foram feitas alterações. Pode fazê-lo de qualquer forma razoável, mas não de forma a sugerir que o licenciador o apoia ou subscreve o seu uso da obra.
- partilha nos termos da mesma licença – Se remisturar, transformar ou ampliar o conteúdo, tem de distribuir as suas contribuições com a mesma licença ou uma licença compatível com a original.

|
É concedida permissão para copiar, distribuir e/ou modificar este documento nos termos da Licença de Documentação Livre GNU, versão 1.2 ou qualquer versão posterior publicada pela Free Software Foundation; sem Secções Invariantes, sem textos de Capa e sem textos de Contra-Capa. É incluída uma cópia da licença na secção intitulada GNU Free Documentation License. |
Pode escolher a licença que quiser.
Histórico do ficheiro
Clique uma data e hora para ver o ficheiro tal como ele se encontrava nessa altura.
| Data e hora | Miniatura | Dimensões | Utilizador | Comentário | |
|---|---|---|---|---|---|
| atual | 17h12min de 24 de março de 2020 | | 1 300 × 975 (42 kB) | AkanoToE | Italicized variables |
| 18h08min de 3 de junho de 2006 |  | 1 300 × 975 (42 kB) | Omegatron |
Utilização local do ficheiro
A seguinte página usa este ficheiro:
Utilização global do ficheiro
As seguintes wikis usam este ficheiro:
- cs.wikipedia.org
- en.wikipedia.org
- eo.wikipedia.org
- es.wikipedia.org
- fa.wikipedia.org
- he.wikipedia.org
- it.wikipedia.org
- ja.wikipedia.org
- ko.wikipedia.org
- nl.wikipedia.org
- pl.wikipedia.org
- sk.wikipedia.org
- uk.wikipedia.org
- vi.wikipedia.org
- zh.wikipedia.org
.svg)